.png)
.png)


January 22, 2026
Forecasting Labor Shortfalls And Overtime Risk
Labor shortfalls and overtime aren't just inconvenient byproducts of scheduling they're clear signals that something's out of balance between workload and workforce capacity. Too often, floor managers see these issues only when they're already in full swing: overtime hours balloon, quality slips, and employees edge toward burnout.
What if you could spot these pinch points well before the system buckles? Forecasting labor gaps and overtime risk isn't about crystal balls or vague predictions. It's about using grounded, data-driven insights to shine a spotlight on where supply won't meet demand and giving operators time to adjust course.
This article breaks down how practical, AI-supported forecasting works, why separating labor demand from effective supply matters, and how you can act earlier to reduce costly overtime and the fatigue that follows. No hype just a clear look at how data becomes a tool in the operator's toolkit for scaling workforce capacity without surprises.
Understanding the Components of Workforce Forecasting
Separate Labor Demand from Labor Supply
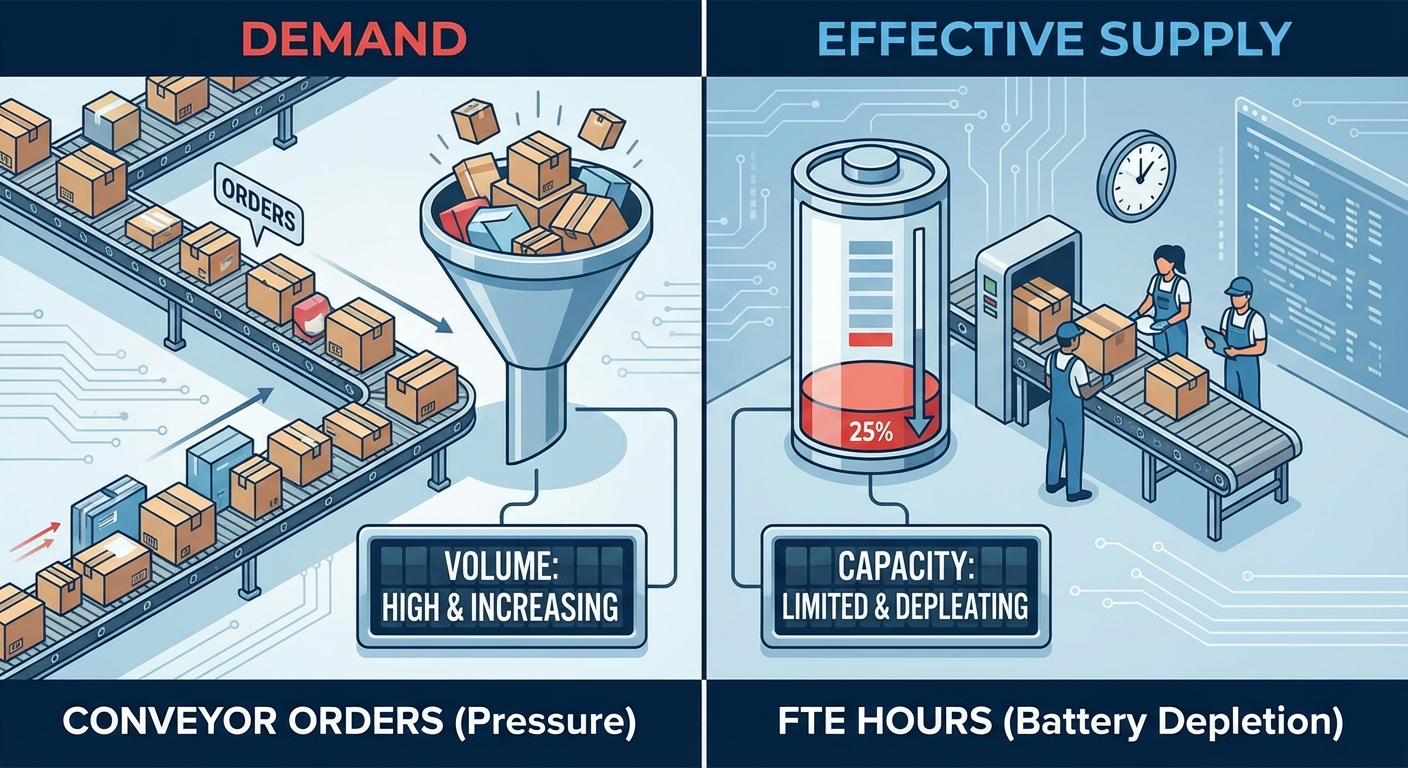
A common misunderstanding in workforce planning lies in equating headcount with true capacity. It's tempting to think that if you have 100 people on the floor, you have 100 units of capacity. But effective capacity is nuanced; it depends on how much actual productive time those people can contribute to meeting the workload demands.
Labor demand reflects the specific work your operation must complete. This is shaped by daily volumes, service commitments, complexity of tasks, and the skills required to perform them. For instance, in a logistics warehouse, labor demand consists of orders to be fulfilled and includes varied tasks such as picking, packing, inbound receiving, putaway, and replenishment, each with different workflows and equipment capabilities. These are often assigned based on specialized certifications or skill profiles.
Contact centers manifest demand in different ways, such as channel-specific volume (phone, chat, email), handle times, and concurrent workloads. Demand is multi-dimensional, not a single undifferentiated number—it is essential to model demand by skill and by time period to capture the real work your team must do.
On the other hand, labor supply means the effective capacity available to meet this demand. You begin with full-time equivalent (FTE) hours available, based on the active workforce on hand. However, this raw number must be adjusted for a range of shrinkage factors including planned absenteeism (vacation, sick leave), unplanned absenteeism, training requirements, meetings, breaks, and productivity losses. In addition, real-world productivity rarely matches the standard ideal. For example, if the expected output is 120 lines per hour in a picking operation, but the actual average is closer to 108, then your effective capacity is approximately 90% of nominal hours.
Ignoring these nuances risks underestimating shortfalls or failing to see latent issues in workforce availability. Modeling labor demand and supply separately, with honest assumptions, helps spotlight the real gaps that otherwise hide behind headcount alone. This approach aligns with workforce planning frameworks recommended by authorities such as the Office of Personnel Management (OPM), ADP, and AIHR.
Perform a Gap Analysis
With clear projections of demand and effective labor supply in hand, the next step is to perform a gap analysis to quantify shortfalls by skill and time horizon.
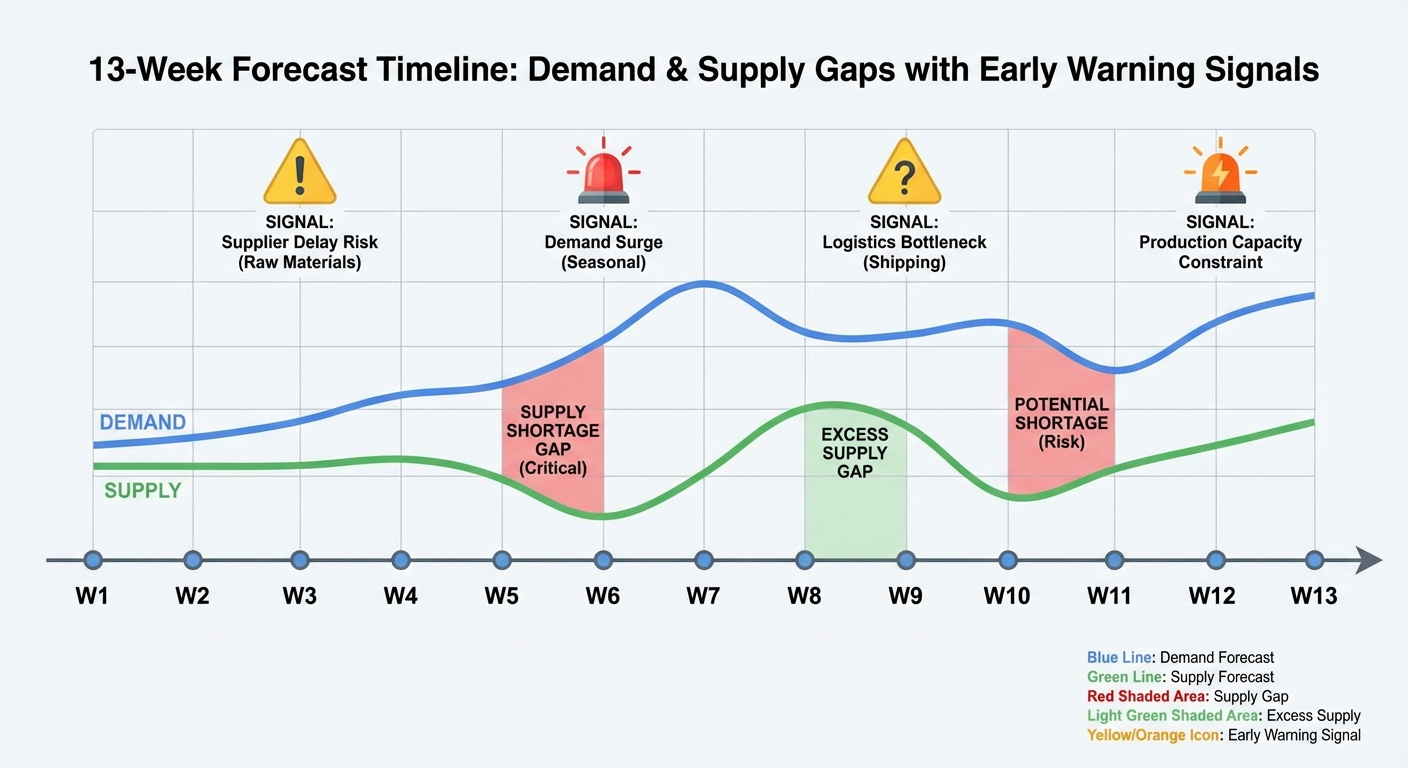
Typically, demand and supply are forecasted on a rolling 13-week horizon and bucketed in weekly intervals, sometimes refined into daily time slots to enable granular scheduling.
Consider an example where Week 6's picking workload demands 12,600 labor hours but the adjusted effective labor supply is only 10,800 hours. The model flags a shortfall of 1,800 hours for that skill and time bucket. Over several weeks, these numbers may fluctuate or compound, revealing trends or escalating pressure points.
Risk analysis should supplement this gap quantification, acknowledging forecasting uncertainty. Variability in seasonal demand surges, changes in customer buying patterns, unplanned absenteeism spikes, or turnover fluctuations affect how accurate these projections will be. Working with scenario ranges—best case, most likely, and worst case—helps plan contingencies and set appropriate response triggers.
Breaking demand and supply down by skill groups should mirror actual operational roles such as pickers, packers, quality control, forklift operators, or contact center teams. Time buckets must align with shift start/end patterns and key planning horizons to maximize practical use.

Translating Labor Gaps into Overtime and Burnout Risk
Estimating Overtime Demand
Labor shortfalls rarely translate one to one into overtime hours. Constraints such as labor laws, union agreements, shift limits, and physiological fatigue set practical caps on how much overtime can be deployed.
Scheduling guardrails include thresholds such as:
- Maximum weekly work hours (e.g., 40 regular hours with limited overtime)
- Maximum number of consecutive working days
- Mandatory breaks and rest periods
- Maximum daily overtime hours
Returning to the example where a 1,800-hour labor shortfall exists, let's say the operation has 200 qualified pickers available. If each picker can reasonably perform 10 hours of overtime weekly, the theoretical overtime capacity is 2,000 hours. However, when factoring in mandated breaks, safety rules, and diminishing returns due to fatigue, actual achievable overtime may be only 60–70% of that roughly 1,200 to 1,400 hours. This leaves unmet demand and potential backlogs or unmet service levels.
Monitoring fatigue thresholds is critical because sustained overtime reduces worker productivity and increases the risk of errors, accidents, and employee burnout. Studies from manufacturing, healthcare, and logistics sectors indicate that when overtime exceeds 10–15% of total labor hours for prolonged periods (two or more weeks), quality and safety indicators tend to degrade markedly.
No one-size-fits-all threshold applies; each operation should validate these tipping points with its own operational data and safety records. Having these thresholds embedded in forecasting transforms raw labor gap numbers into actionable operational risk assessments. It clarifies how much overtime will be necessary, how sustainable it might be, and what quality and safety risks may arise.
Early Warning Through Predictive Analytics
Artificial Intelligence (AI) and machine learning enhance forecasting by accelerating calculations and integrating diverse signals, but they don't replace human judgment. Instead, AI acts as a diagnostic and advisory tool.
Operators should track leading indicators that forecast near-term changes in demand or supply, including:
- Changes in absenteeism and schedule adherence rates
- Trends in hiring funnel velocity and onboarding completion rates
- Shifts in training pass rates or certification renewals
- Customer booking patterns or inbound freight manifests
- Workload spikes or dips from new contracts or promotions
Forecast models benefit from running "what-if" scenario simulations, answering questions like:
- What happens if attrition doubles over the next six weeks?
- What if a hiring cohort delays starting by two weeks?
- How does a 20% surge in customer demand impact labor gaps?
These scenarios quantify exposure to risk and help secure pre-approvals for tactical actions such as controlled overtime, temp labor augmentation, or training investments.
Ongoing recalibration is essential. Forecasts drift over time as assumptions about productivity, shrinkage, or demand evolve. Weekly comparisons of forecast to actual results enable tuning of the model, improving accuracy and operator confidence. This feedback loop is a best practice advocated by workforce planning veterans and researchers at OPM, ADP, and IBM.
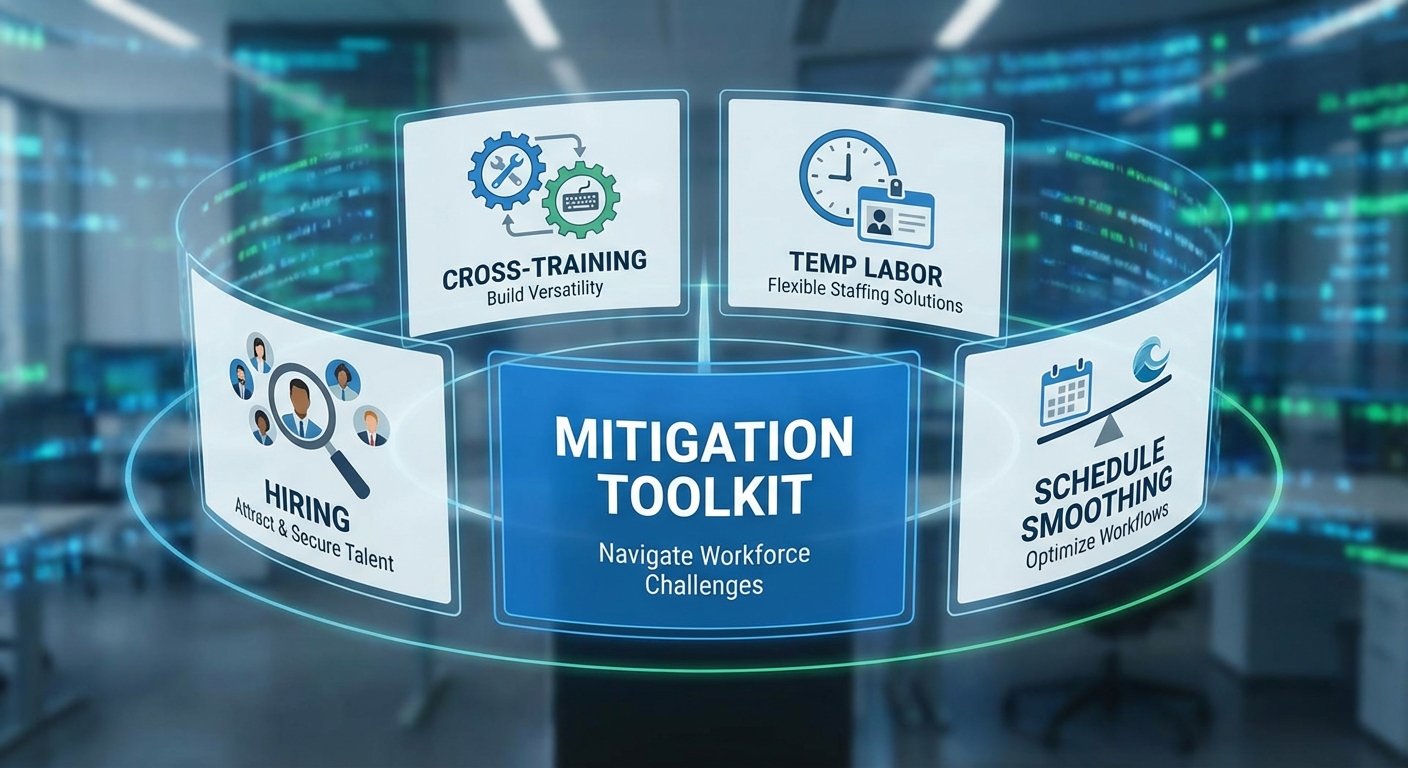
Practical Levers to Mitigate Shortfalls and Overtime Risk
Targeted Hiring
Hiring is most effective when driven by precise forecasts of skill and timing.
Requisitions should target specific skill groups and prioritized start dates aligned to forecasted gaps. For example, if forklift operators have a 28-day recruiting cycle and a 10-day onboarding period, and a shortage is projected for Week 8, hiring offers need to be extended by Week 4 at the latest.
Tracking hiring yield metrics such as start rates and 90-day retention is crucial to setting realistic pipelines. If only 60% of offers convert to starts, and 80% remain past 90 days, then 10 requisitions produce around 5 reliable operators by month three. Factoring this attrition norm helps avoid last-minute scrambles and reactive firefighting hiring.
Cross-Training and Flexible Deployment
Building versatility into the workforce unlocks latent capacity without additional headcount or overtime costs.
Cross-training operators in adjacent roles (e.g., pickers cross-trained to pack, receivers cross-trained on putaway) allows more flexible deployment to cover shifting demands. This strategy reduces dependency on overtime and serves as a buffer for sudden supply shocks.
Aim to cross-train where demand variability is highest and where ramp-up time is feasible. Even modest cross-coverage (10–20% of a team) can dampen overtime spikes and improve operational resilience.
Temporary Labor and Agency Support
Temporary staffing, when managed as a product with defined service levels, can provide a crucial buffer during peak workloads.
Clearly define expectations on temp labor including:
- Skill validation and certifications
- Safety and operational training completion
- Guaranteed fill rates and quick response timeframes
Assign temporary staff primarily to less complex or lower-risk tasks, freeing experienced operators for high-value activities.
Account for productivity ramp-up—the first week of temp labor often delivers below-average performance. Adjust forecasts accordingly to set realistic expectations.
Schedule Optimization and Demand Smoothing
Sometimes, adjusting when work occurs rather than who does it can prevent pressure points.
Strategies include:
- Aligning shift curves to match forecasted demand peaks and valleys, staggering breaks to maximize coverage
- Shifting non-urgent tasks or administrative duties out of peak hours
- Pre-building kits, pre-printing labels, or staging inbound materials in slow periods to ease peak demand
- Negotiating with customers on order cutoffs or delivery windows to smooth demand rhythm and reduce forced overtime
These upstream efforts can reduce downstream pressure to rely excessively on overtime.
Overtime Caps and Fatigue Management
Overtime must be managed deliberately as a pressure valve, not a crutch.
Set clear limits on maximum allowable overtime, for example:
- No more than 8–10 overtime hours per person per week
- No more than two consecutive weeks exceeding the cap without dedicated review and approval
Track cumulative workloads including rolling four-week total hours, consecutive days worked, and compliance with rest period requirements.
Monitor productivity and safety indicators closely. If error rates or incidents increase alongside overtime usage, it signals the need to cut back even if backlogs grow temporarily. The long-term financial and human costs of burnout, injury, and rework outweigh short-term delays.
The Role of Systems Thinking and Continuous Review
Workforce forecasting is not a one-time initiative; it is a continuous control loop requiring collaboration and discipline.
Establish a weekly workforce review rhythm that involves operations leadership, HR partners, and finance. This review should cover:
- Prior week actuals—demand, supply, productivity, shrinkage, overtime
- Updated 13-week outlook and scenario analyses
- Planned mitigation actions and trigger points
Leverage a single-source-of-truth model accessible to recruiting, scheduling, and finance to align planning and budgeting around a shared forecast.
Align incentives around sustainable performance metrics such as acceptable overtime rates, quality targets, and retention goals rather than purely short-term output gains.
Assign clear ownership of forecasting accuracy and version control to one accountable operator, ideally within or very close to operations. While data and input come from many sources, centralized coordination preserves focus and ensures regular updates.

An Example from the Floor
At All Points Distribution, during a recent seasonal ramp, early warning signs emerged: schedule adherence in receiving dropped by two percentage points, absenteeism among picking increased week over week, and the forklift operator hiring funnel slowed.
The 13-week forecast predicted a manageable picking shortage in Week 7, which then expanded sharply by Weeks 9 and 10, driven by a new client's demand spikes.
Armed with this insight, leadership acted early:
- Cross-trained 30 packers on picking tasks with a planned two-week ramp
- Rescheduled cycle counts to off-peak hours to free picker capacity
- Pre-built SKU kits and pre-printed labels to flatten peak workload
- Secured a 10-day lead order of temp labor for simpler tasks
- Instituted a temporary overtime cap and rotated assignments to minimize fatigue clustering
While overtime did occur, spikes were brief and quality maintained. Service level agreements (SLAs) were met with less disruption and lower risk of burnout.
Forecasting didn't eliminate uncertainty—it created the runway to make informed operational trade-offs well in advance.
Implementation Notes: How to Get Started in 60 Days
- Build your data foundation. Gather 12 to 18 months of historical demand, staffing, and productivity data broken out by skill to enable meaningful modeling. Aim for usability over perfection; data quality improves iteratively.
- Develop a simple initial forecast model. Create a rolling 13-week forecast in weekly buckets, with three scenarios (best, most likely, worst). Model demand as a time series augmented with known future events, and represent supply as FTE count × hours × shrinkage × productivity. Target initial accuracy of 10–15% at skill-week level.
- Define triggers and thresholds. For example, flag projected overtime exceeding 12% of labor hours for two consecutive weeks, or gaps over 8% three weeks out, or absenteeism rises above 2 percentage points. Establish pre-approved mitigation steps tied to these triggers.
- Set an operating rhythm. Schedule weekly forecast updates owned by a designated lead, with one cohesive presentation and decision-making meeting.
- Iterate and improve. Monthly recalibrate assumptions on shrinkage, productivity, and staffing. Incorporate additional leading indicators and refine scenarios over time.
Publicly available resources, for example, the OPM workforce planning guide, HR analytics insights from AIHR and ADP, and sector studies on fatigue risk, support these foundational practices: separate demand and supply, run scenarios, maintain feedback loops.
Conclusion: What Changes, and What Won't
Forecasting never eliminates uncertainty, but it reduces it giving operators earlier visibility to make cost-effective, proactive choices.
What changes:
- Overtime becomes a calculated, planned response not reactive desperation.
- Hiring aligns directly with precise skill shortages and respects lead times.
- Cross-training, temporary labor, and schedule design become strategic levers rather than last-minute fixes.
- Customer conversations transition from firefighting to demand shaping and partnership.
What likely won't:
- Complete removal of overtime or burnout risk—real-world volatility and human limits remain.
- Forecast models that run autonomously; human insight, discipline, and operational expertise remain essential.
Ultimately, forecasting labor shortfalls and managing overtime risk is a systems capability built on consistent practice, data integrity, and collaborative decision-making. Applied well, it balances workforce capacity and workload, protecting both people and margins before strain shows up on the floor.
Related Reading
- How AI Acts Like a Junior Ops Manager
- Catching Inventory Integrity Issues Early
- Turning Messy Operational Data into Decisions with AI
- AI in the Warehouse Isn't Robots — It's Better Decisions
This article is for informational purposes only. Carrier rates, surcharges, and policies change frequently — always verify current terms directly with the carrier for your specific situation. Have questions? Reach out to us — we're happy to help.

Meet the Author
paul@darrigoconsulting.com
I’m Paul D’Arrigo. I’ve spent my career building, fixing, and scaling operations across eCommerce, fulfillment, logistics, and SaaS businesses, from early-stage companies to multi-million-dollar operators. I’ve been on both sides of growth: as a founder, an operator, and a fractional COO brought in when things get complex and execution starts to break